

1
/
の
4
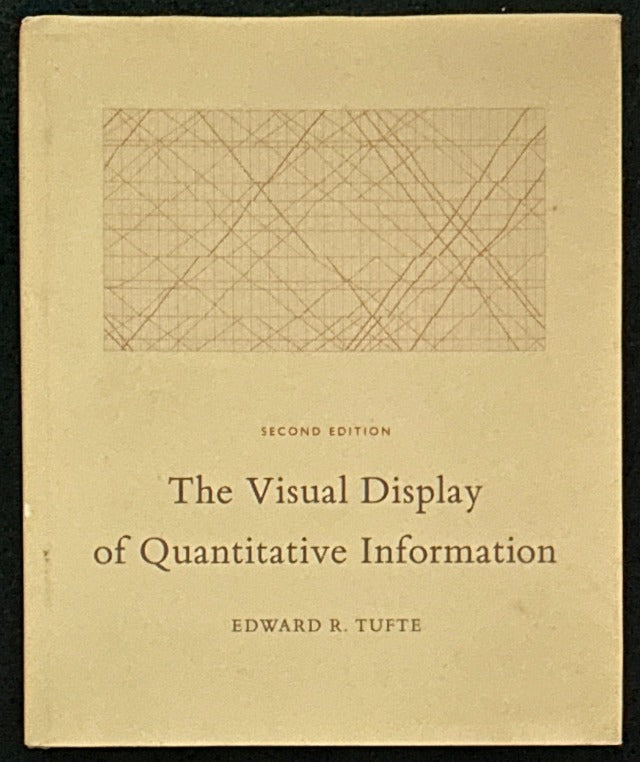
The Visual Display of Quantitative Information
The Visual Display of Quantitative Information
通常価格
¥5,200 JPY
通常価格
セール価格
¥5,200 JPY
単価
/
あたり
税込
配送料はチェックアウト時に計算されます。
受取状況を読み込めませんでした
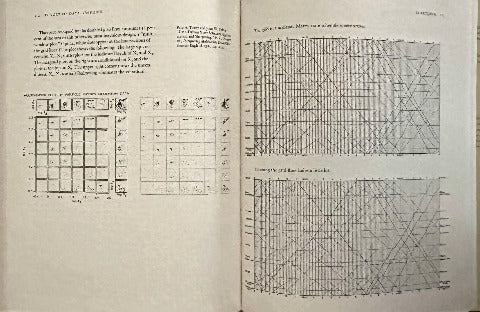
統計グラフィック、チャート、表に関する古典的な本だが、現在のデータヴィジュアライゼーションに先駆けるもの。データ・グラフィックスのデザインにおける理論と実践。
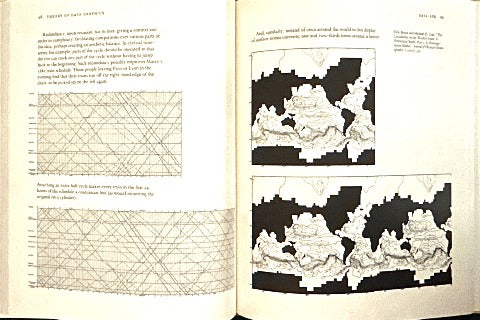
250の図解による統計グラフィックスと、正確で効果的かつ迅速な分析のためのデータ表示方法の詳細な分析。高解像度ディスプレイのデザイン、小さな倍数。グラフィックの編集と改善。データの可視化( Data-ink Ratio)、時系列,リレーショナルグラフィックス,データマップ,多変量設計。 グラフィックのごまかしの検出。本書は『The Visual Display of Quantitative Information』の第2版である。
A classic book on statistical graphics, charts, and tables, but a precursor to current data visualization. Theory and Practice in the Design of Data Graphics.
250 illustrated statistical graphics and detailed analysis of how to display data for accurate, effective, and rapid analysis. Design of high-resolution displays, small multiples. Graphics editing and improvement. Data visualization (Data-ink Ratio), time series, relational graphics, data maps, multivariate design. Detecting fudging of graphics. This is the second edition of The Visual Display of Quantitative Information.
Edward R. Tufte
Graphics Press LLC.
2001
27.1 x 22.5 x 2.3 cm
197 pages
Share